
Understanding RSSI in Wi-Fi: Useful Signal, Misunderstood Metric
If you spend any time around Wi-Fi engineers, you’ll quickly hear someone say something like: “What’s the RSSI there?”
RSSI is one of the most commonly referenced measurements in wireless networking, and also one of the most misunderstood. New engineers often treat it as the signal quality metric. In reality, it’s more like a clue rather than a conclusion.
Let’s unpack what RSSI really is, what it isn’t, and how to use it properly in real-world Wi-Fi engineering...
What RSSI Actually Means
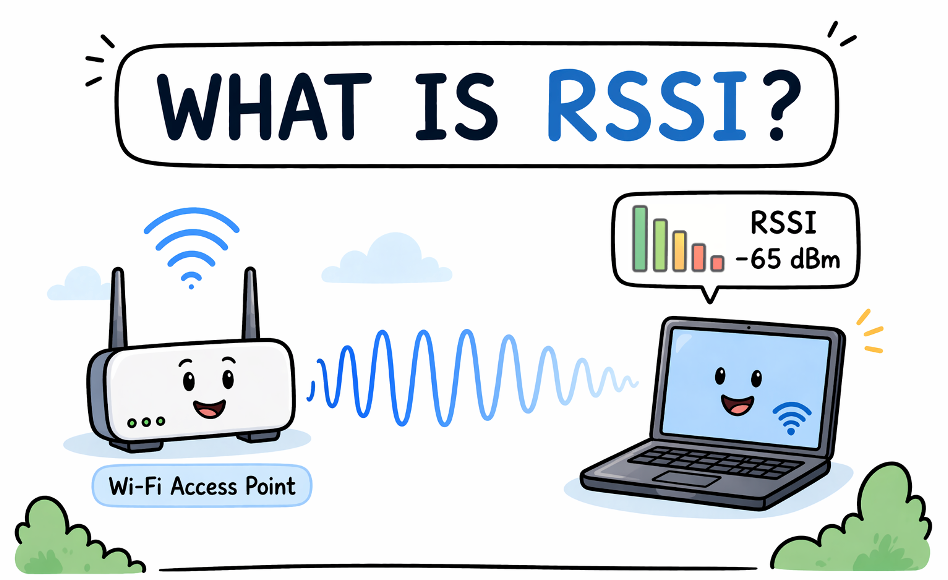
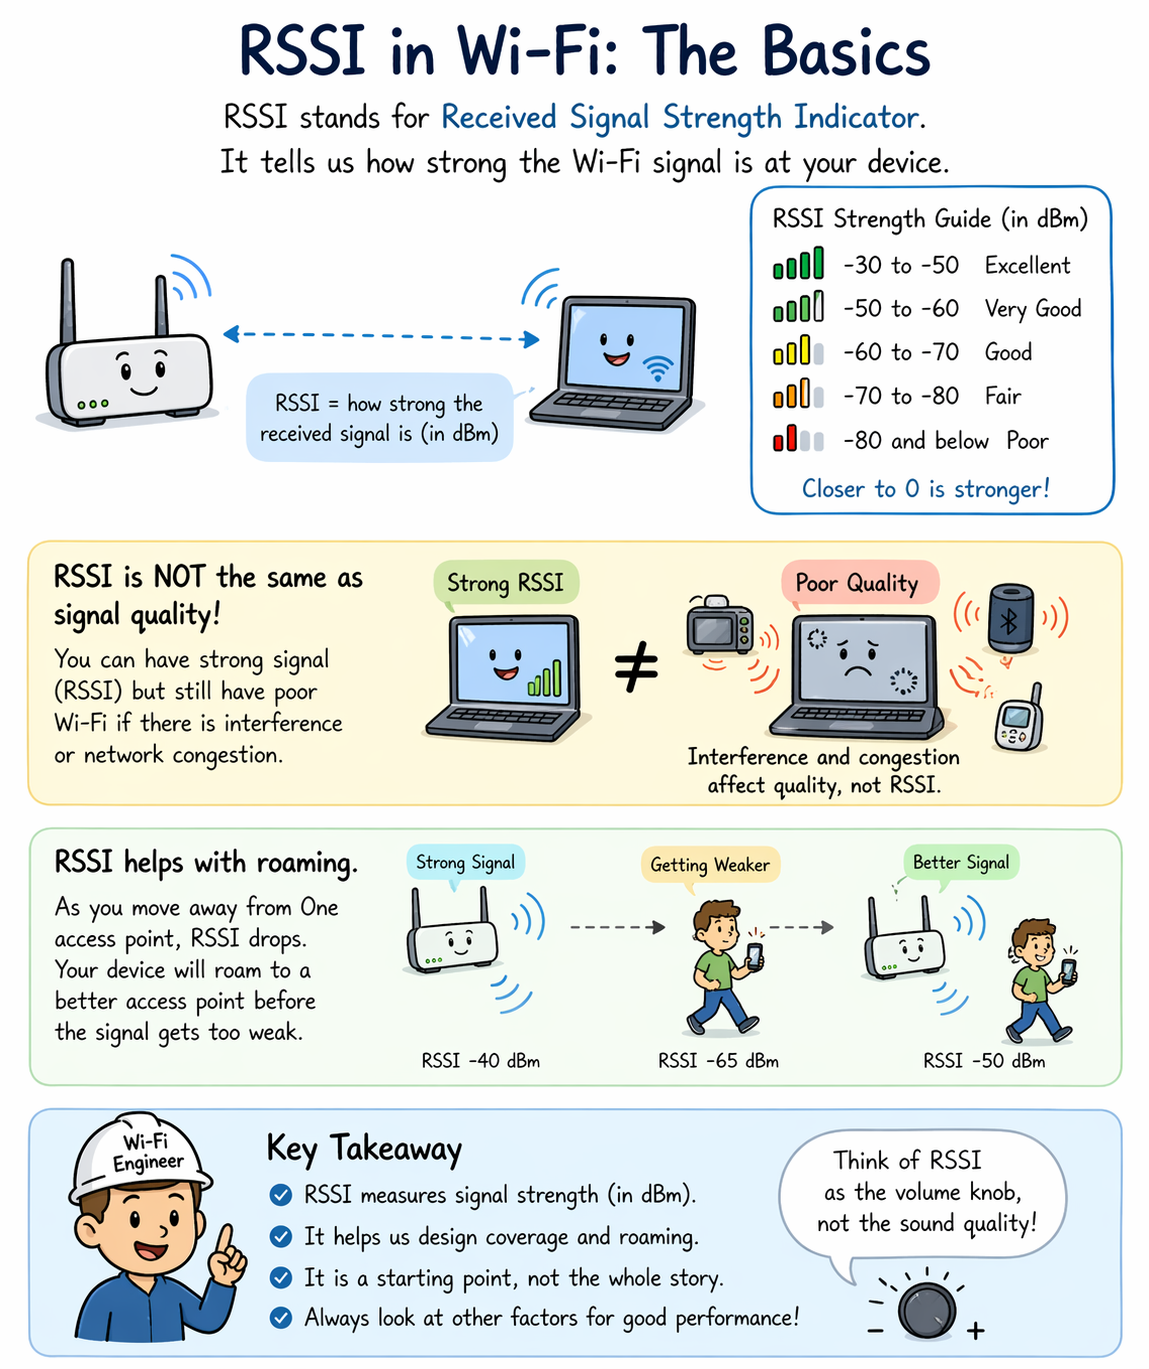
RSSI stands for Received Signal Strength Indicator. It represents how strong the received RF signal appears at a wireless client or access point.
Most Wi-Fi tools display RSSI in dBm, which is a logarithmic measurement of signal power referenced to 1 milliwatt.
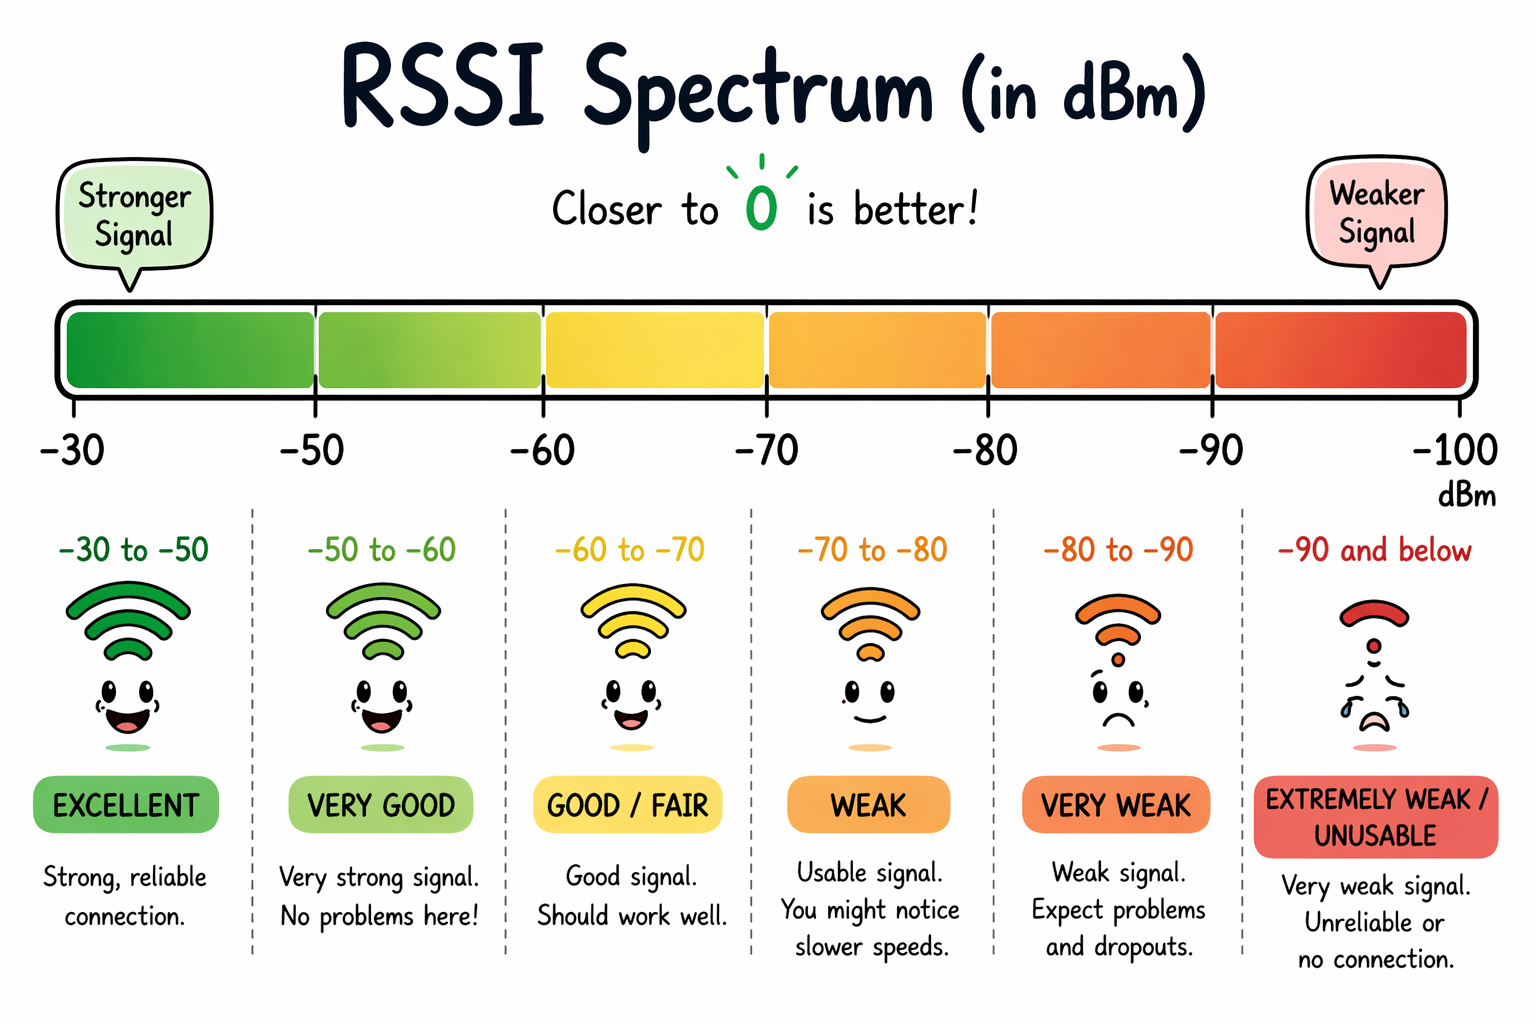
Typical Wi-Fi RSSI values look like this:
• -30 dBm → Extremely strong signal (standing next to the AP)
• -50 dBm → Excellent signal
• -60 dBm → Very usable signal
• -67 dBm → Often considered the VoIP/design target
• -70 dBm → Still usable for many applications
• -80 dBm → Borderline reliability
• -90 dBm → Mostly wishful thinking
Notice something important: RSSI values are negative. That’s not because your Wi-Fi is bad, it’s because received RF power is typically below 1 milliwatt.
Closer to zero = stronger signal.
Why Engineers Care About RSSI
RSSI helps answer several important design and troubleshooting questions:
· Is the client close enough to the AP?
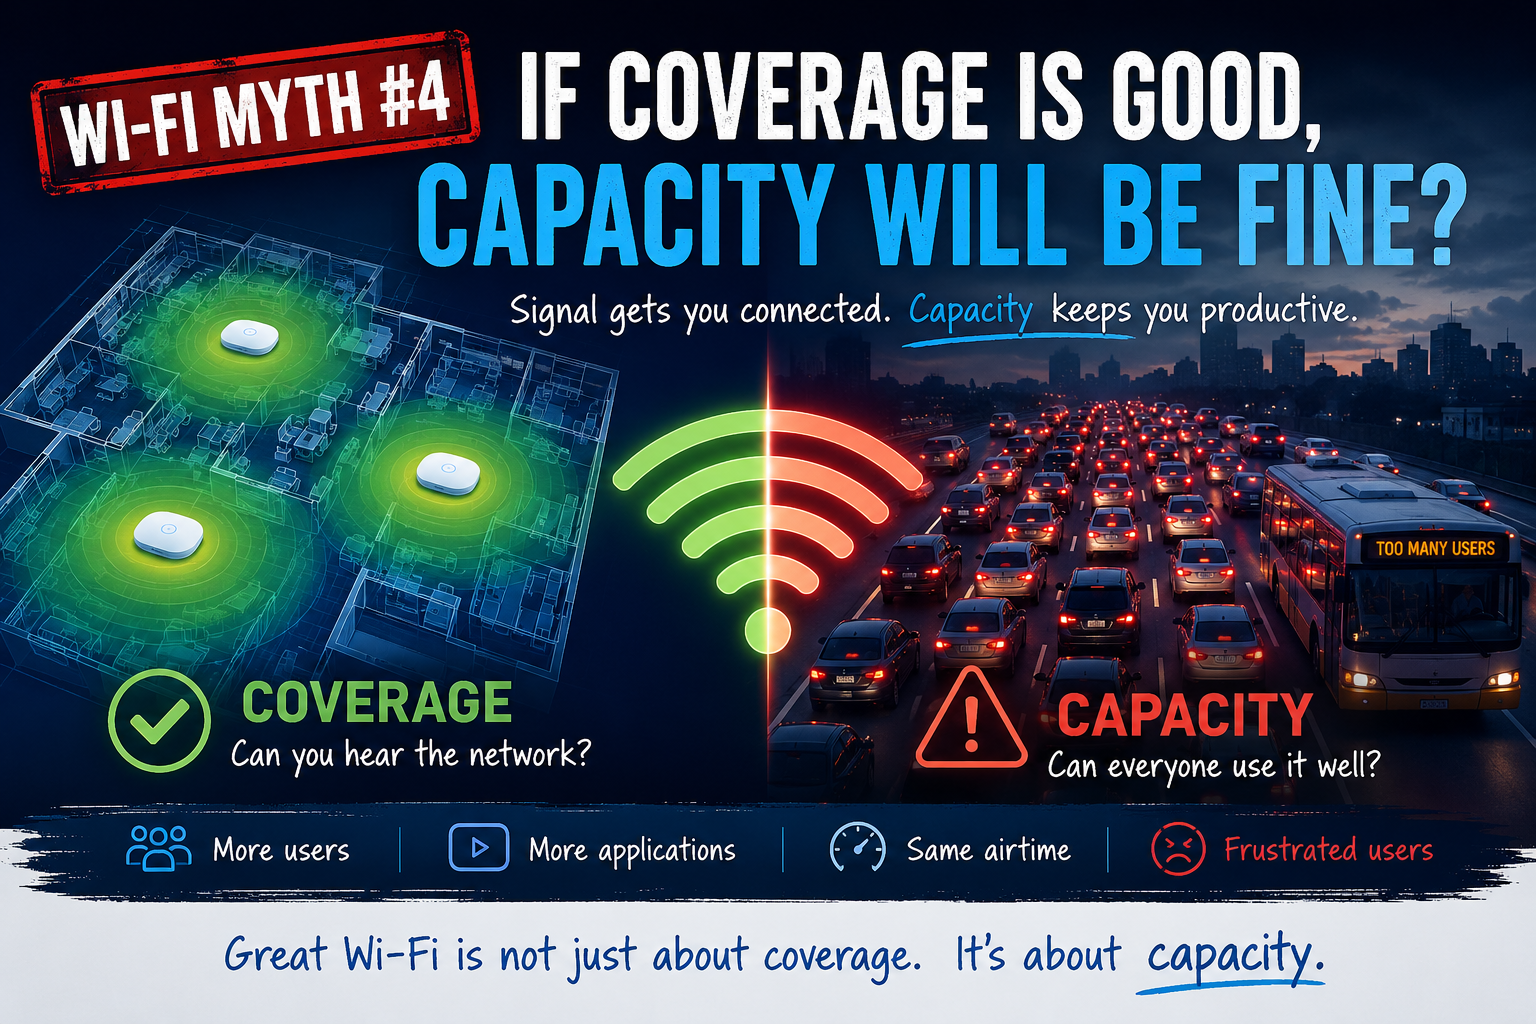
· Is coverage sufficient in this area?
· Will roaming occur soon?
· Is transmit power balanced correctly between cells?
In site surveys, RSSI is often the first indicator used to determine whether coverage meets design goals. But <<and this is critical>> RSSI, alone, does not determine performance!
Think of RSSI like the volume knob on a radio. Loud audio doesn’t guarantee clear audio.

RSSI Is Not the Same as Signal Quality
One of the biggest early-career mistakes Wi-Fi engineers make is assuming: Strong RSSI = good Wi-Fi, but that’s not necessarily true.
Imagine this scenario:
Your client reports -55 dBm RSSI. It sounds excellent, but the performance is terrible. Why?
Because RSSI measures signal strength, not signal clarity.
For clarity, we look at:
• SNR (Signal-to-Noise Ratio)
• interference levels
• channel utilization
• retries
• contention
RSSI tells you how loud the signal is. SNR tells you how understandable it is. Both matter.
RSSI Depends on Who Is Measuring It
Here’s something subtle but important: RSSI is not standardized across vendors.
Different chipsets may calculate RSSI slightly differently. This means:
• AP RSSI readings
• laptop RSSI readings
• phone RSSI readings
…may not perfectly match even in the same location.
So, if one device reports -65 dBm and another reports -68 dBm, don’t panic. That’s normal. Simply treat RSSI as a guideline measurement, not a precision instrument.
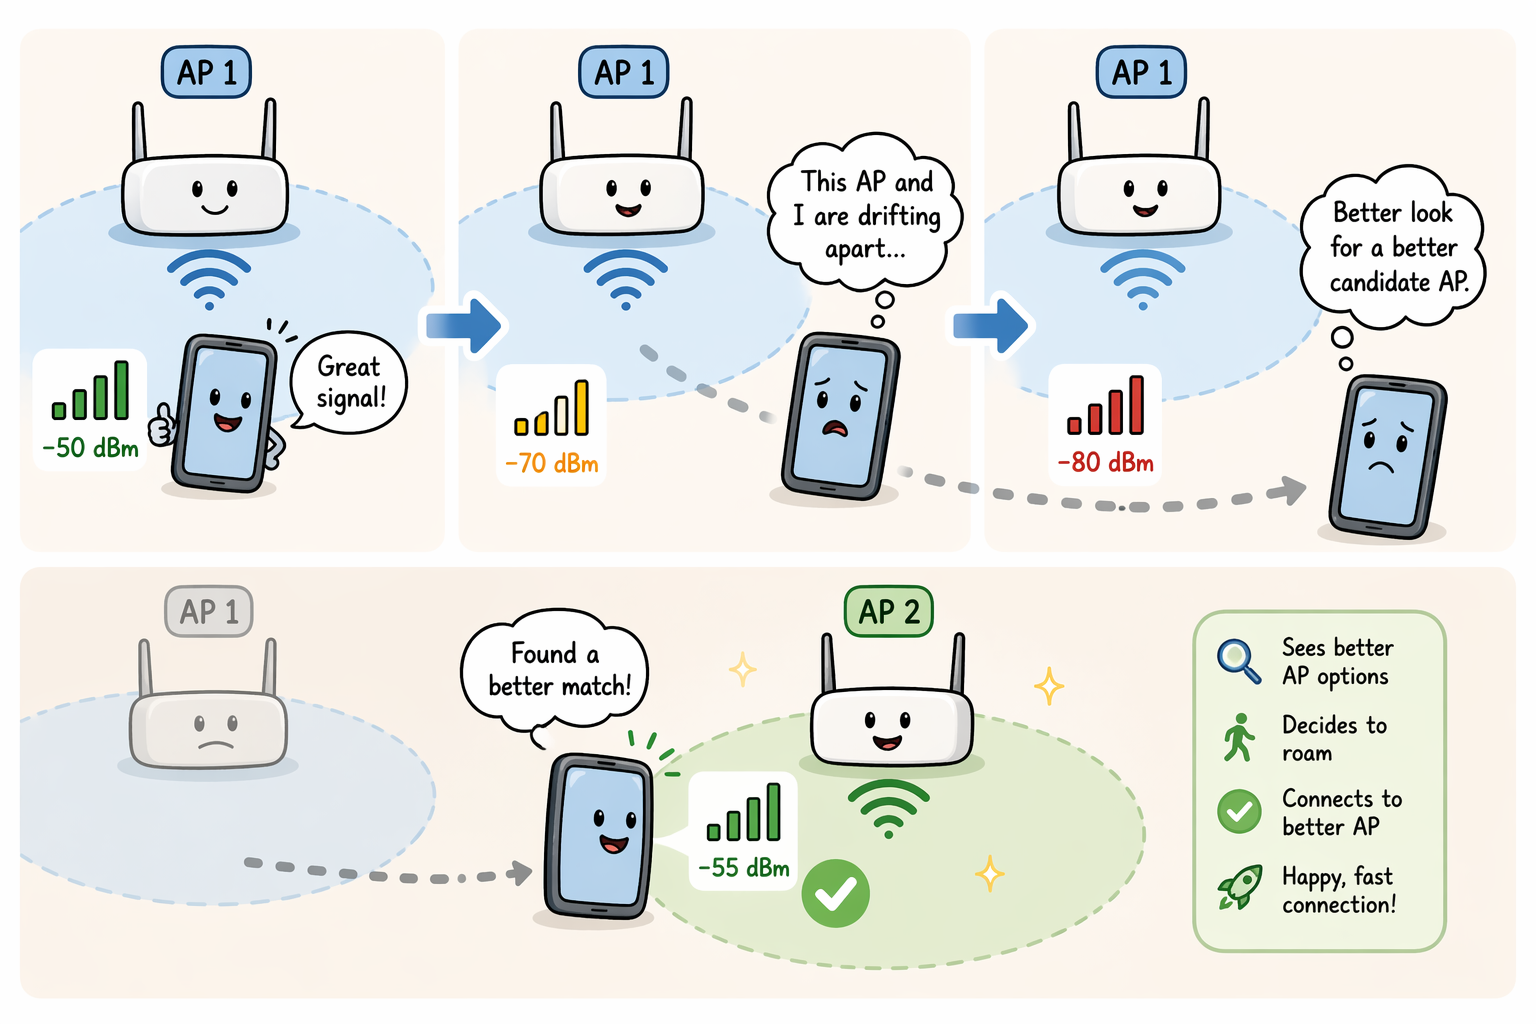
RSSI and Wi-Fi Roaming
RSSI plays a major role in roaming behavior. As a client moves away from an AP, RSSI drops. Eventually the device decides: “This AP and I are drifting apart emotionally and physically.” So, it searches for a better candidate AP.
Many enterprise designs use approximate roaming trigger zones such as:
• roaming begins around -67 to -70 dBm
• disconnection often occurs near -75 to -80 dBm
Exact behavior depends on the client (which is famously independent-minded).
Designers create cell overlap intentionally, so that roaming happens smoothly before performance collapses.
RSSI and Data Rates
Higher RSSI generally enables:
• higher modulation rates
• fewer retries
• better throughput
• lower latency
Lower RSSI forces:
• slower modulation schemes
• more retransmissions
• increased airtime usage
• reduced performance
This is why Wi-Fi design targets often specify minimum RSSI levels, for instance:
• -67 dBm for voice
• -65 dBm for collaboration/video
• -70 dBm for general data
RSSI helps determine whether the physical layer can support the expected application experience.
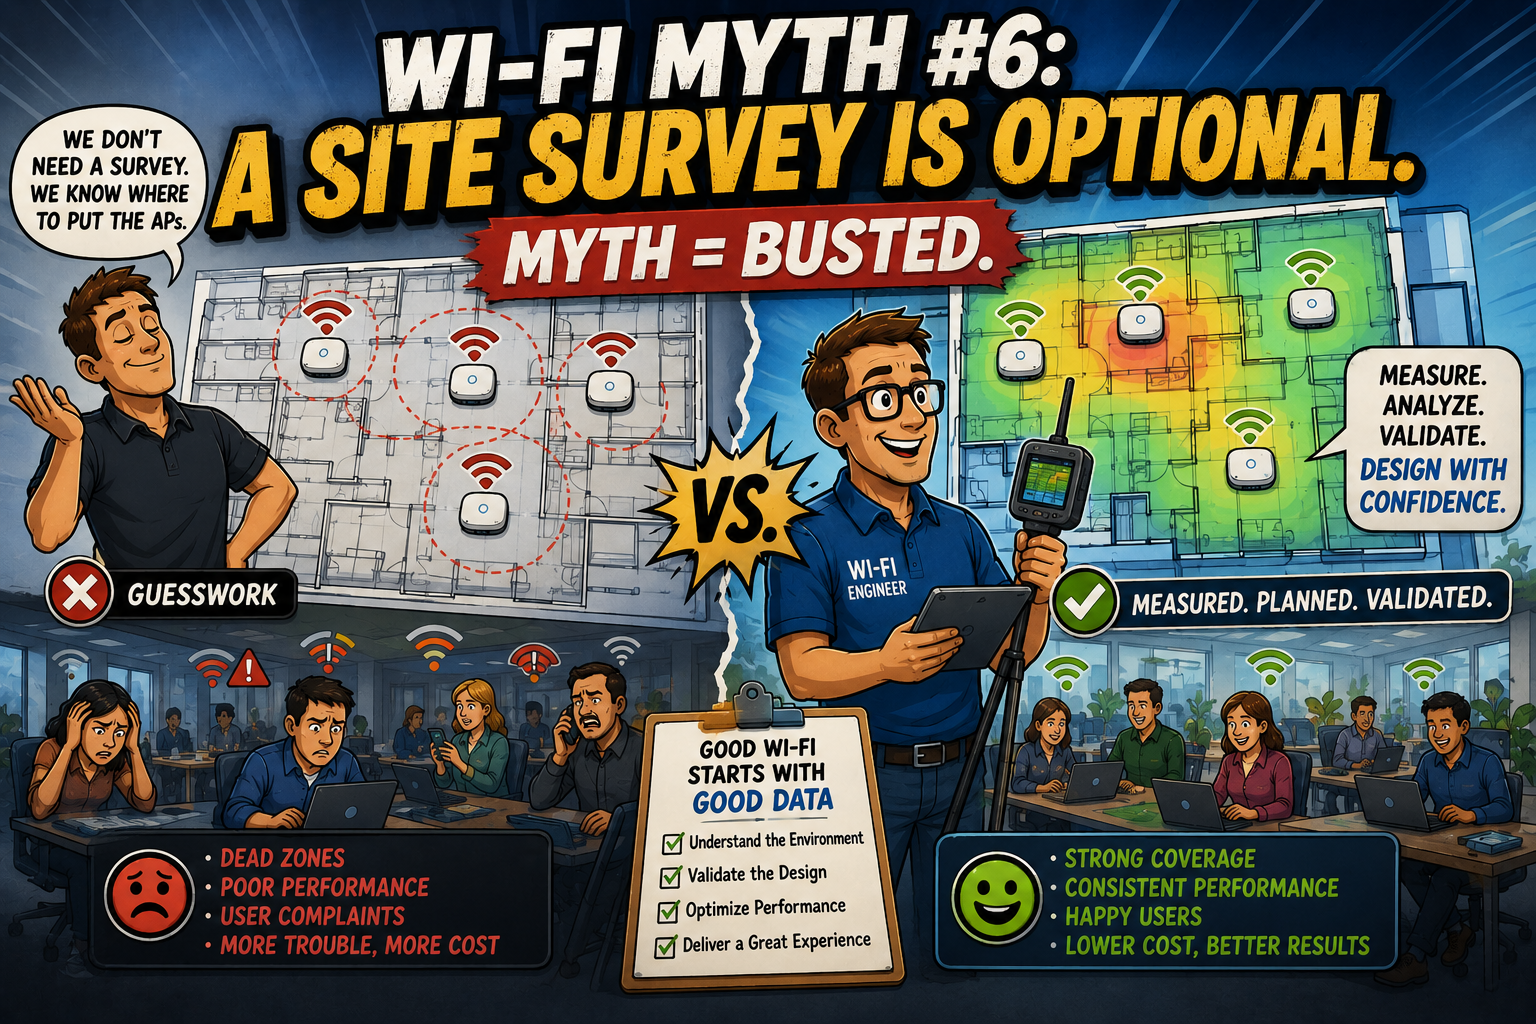
RSSI in Site Surveys
During predictive or validation surveys, RSSI is often used as a primary coverage metric.
Example targets might include the following for coverage:
• -67 dBm primary coverage
• secondary AP visibility at -70 dBm
• tertiary AP visibility at -75 dBm
This enables:
• reliable connectivity
• seamless roaming
• redundancy
• location services (when needed)
If RSSI falls below thresholds, users start noticing problems, even if they can’t explain why.
They’ll usually say, “The Wi-Fi feels slow.” Which is engineering language for, “Something somewhere is below a design threshold.”
RSSI Is a Starting Point, Not the Destination
Professional Wi-Fi engineers don’t stop at RSSI. They usually combine it with:
• SNR
• Retry rates
• Channel utilization
• Spectrum analysis
• Application performance
RSSI answers questions such as, “Can the client hear the AP?” Whereas other metrics may answer questions like, “Can the client communicate efficiently?”
Learning to interpret RSSI correctly is one of the first steps toward thinking like a wireless engineer instead of a signal-bar observer. And once you start seeing RSSI as part of a bigger RF story <<not the whole story>> you’re well on your way to designing Wi-Fi networks that behave the way users expect them to behave.
===
===
Learn More
If you want to learn more about our wireless training and wireless networks, visit our training portfolio page here
===
#WiFi #WirelessNetworks
===
About NC-Expert
NC-Expert is a privately-held California corporation and is well established within the Wireless, Security, and CyberSecurity industry certification training, courseware development, and consulting markets.
NC-Expert has won numerous private contracts with Fortune level companies around the world. These customers have depended on NC-Expert to train, advise, and mentor their staff.
So remember, if you are looking for the best IT training just call us at (855) 941-2121 or contact us
NC-Expert Blog