Riding the Wi‑Fi Waves: Understanding Signal-to-Noise Ratio
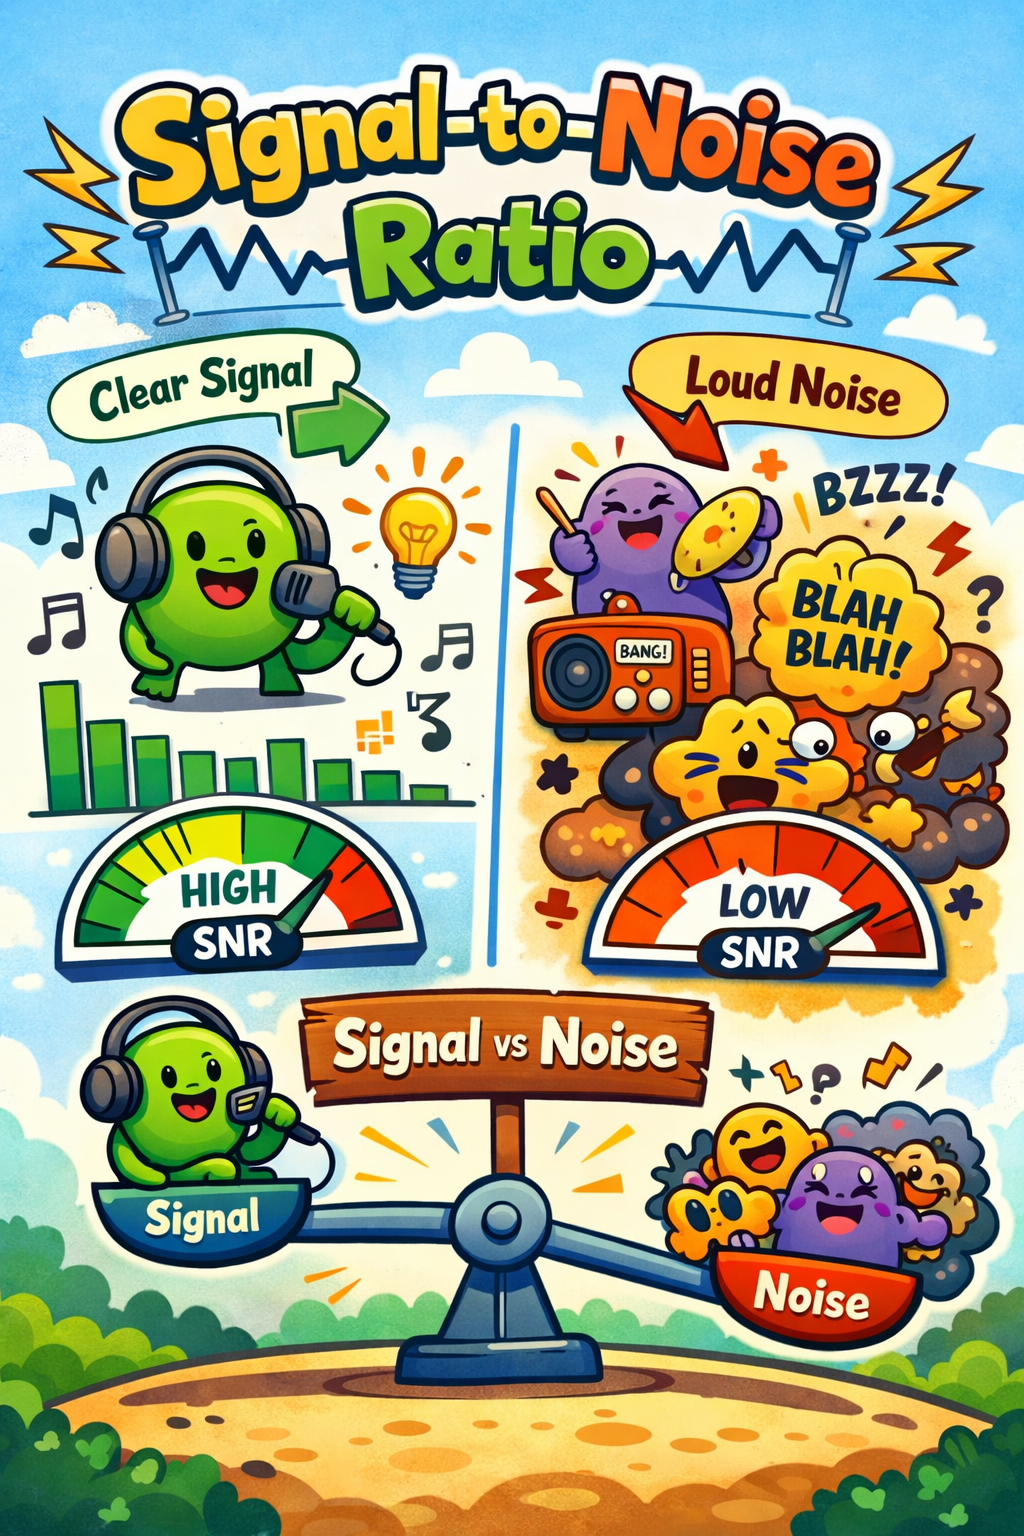
If Wi‑Fi were a party, Signal‑to‑Noise Ratio (SNR) would tell you how well you can hear your friend talking over the background music. Too much noise and you'll start yelling, guessing, or worse: talking to the wrong person entirely!
In networking terms, SNR is what helps determine whether your wireless connection is crisp and clear, or whether it is a glitchy mess that makes you want to throw your router out the window!
For new IT engineers, understanding SNR isn't just about avoiding bad connections, it's about troubleshooting, designing smarter networks, and keeping users from sending "the Wi‑Fi sucks" emails.
So, grab your coffee, let's unpack what SNR really means.
What Exactly Is SNR?
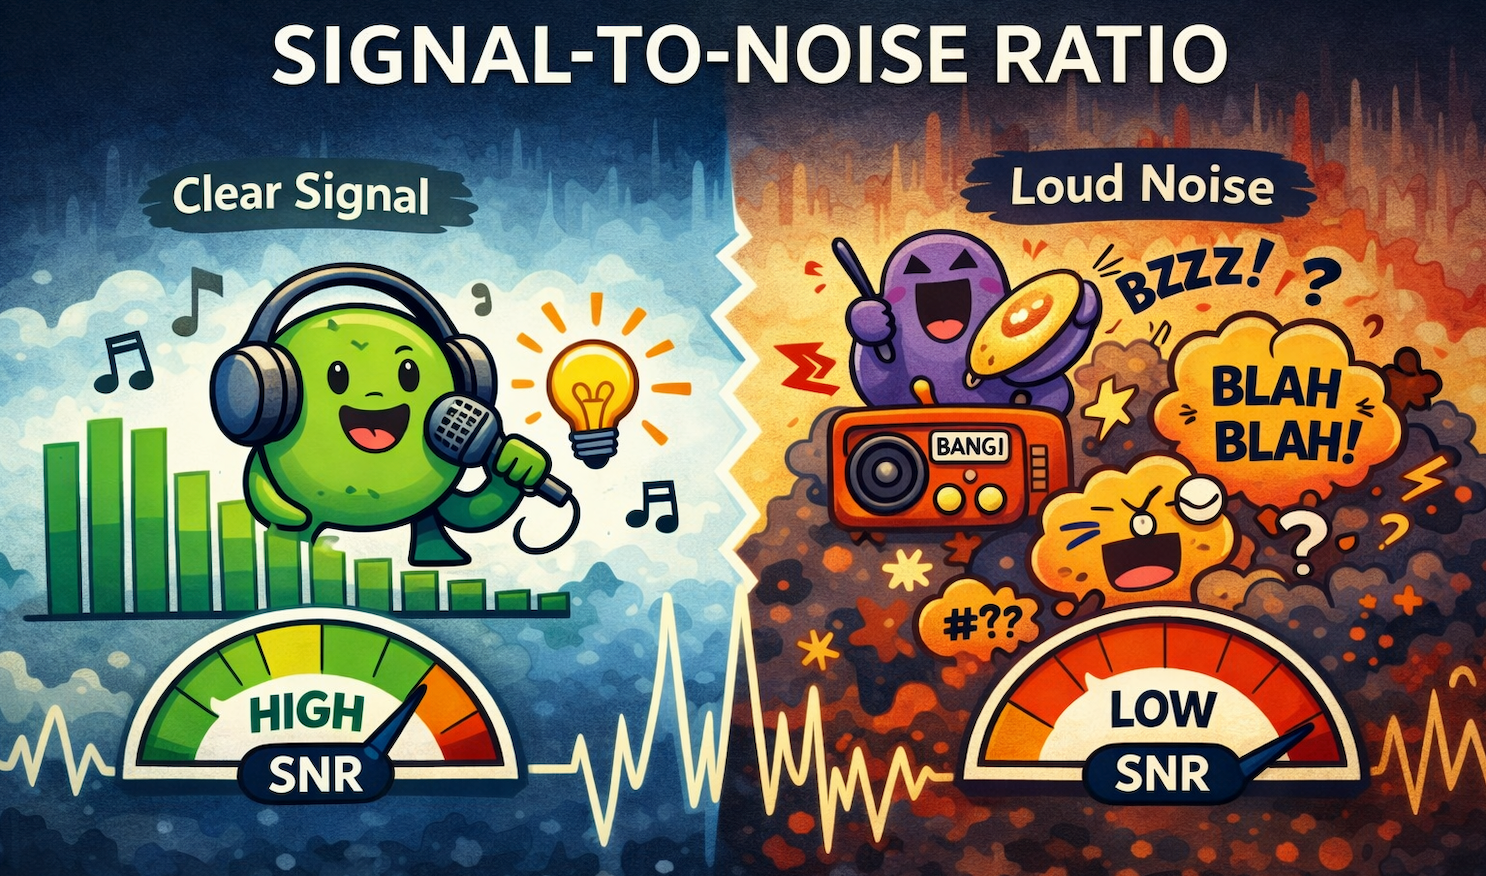
Signal-to-Noise Ratio measures the strength of your wireless signal compared to the amount of background noise. It's expressed in decibels (dB). The higher the number, the better the connection quality.
The formula looks simple enough:
SNR (dB) = Signal Strength (dBm) − Noise Floor (dBm)
Think of it like comparing a singer's voice (signal) to the cheering crowd (noise). If the singer is louder than the crowd, you can understand the lyrics. If the crowd is screaming louder than the singer, all you'll likely catch is the beat... and frustration.
RSSI: The Signal Strength Piece
Before you calculate SNR, you need to know the signal strength, often measured as Received Signal Strength Indicator, or RSSI. RSSI measures how strong a signal is when it reaches your device. It's also expressed in dBm, but here's the catch: it's always a negative number.
Yep, negative numbers. Welcome to the strange world of radio frequency engineering.
The closer the RSSI value is to zero, the stronger the signal. For example:
• An RSSI of -35 dBm is excellent – nice and clear: here, you're practically sitting on the access point!
• -65 dBm is decent – good enough for HD streaming and stable browsing.
• -85 dBm is borderline painful – you should expect dropped connections and slow speeds.
• -90 dBm, or lower, means your Wi‑Fi has effectively left the building!
So, when you see RSSI values improving (getting less negative), your signal's strength is increasing. But RSSI alone doesn't tell the whole story.
The Sneaky Culprit: Noise Floor
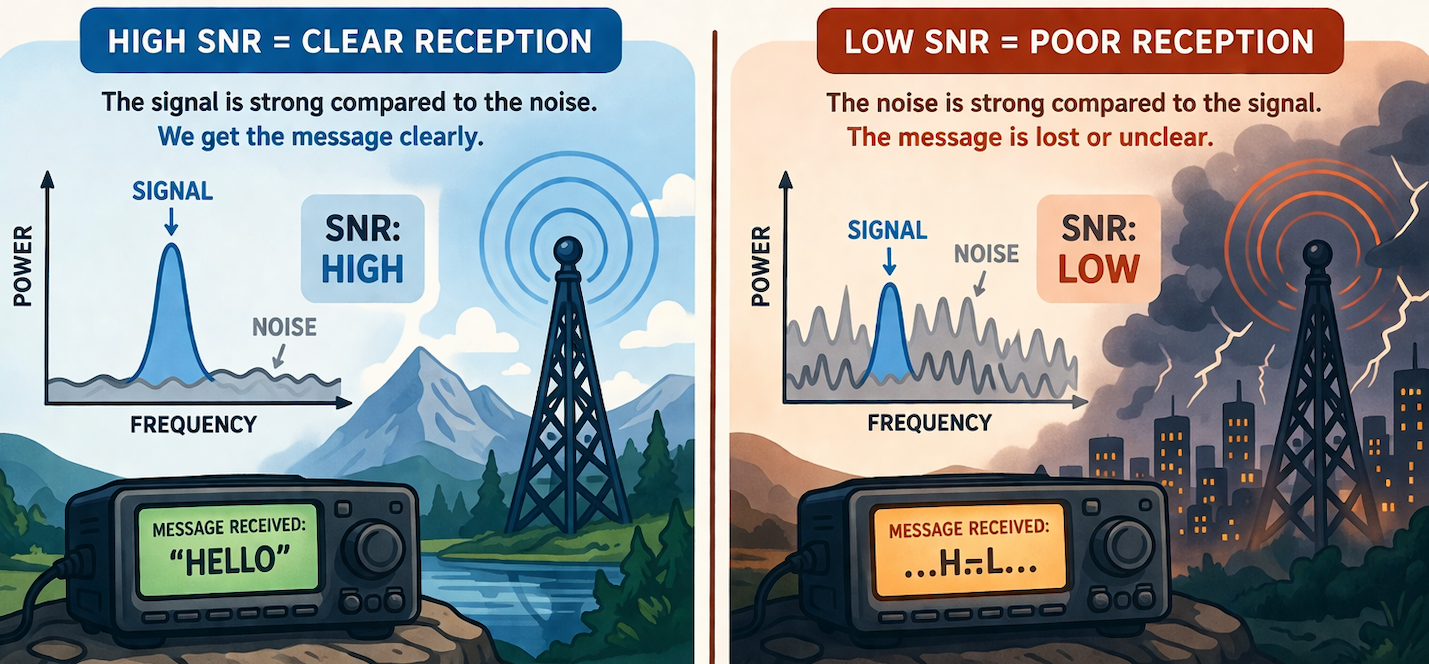
Now meet the troublemaker: the “noise floor”. This is the background "radio chatter" that all wireless signals must shout over, to be heard. It includes interference from other Wi‑Fi networks, Bluetooth devices, microwaves, cordless phones, and even that ancient baby monitor you keep forgetting to unplug. It’s like the general mumble of chatter in a meeting room or at a party.
Noise floor values also appear in dBm and are negative too. Common values land between -90 dBm (very quiet) and -70 dBm (pretty noisy).
A lower (more negative) noise floor means the airwaves are cleaner and your Wi‑Fi has room to breathe. Higher (less negative) noise floors mean the environment is crowded, like trying to talk in a packed bar after a concert.
Putting It Together: SNR in Action
Once you know both RSSI and noise floor, you subtract the two to get SNR. Let's run a quick example:
• RSSI: -65 dBm
• Noise Floor: -90 dBm
• SNR: (-65) - (-90) = 25 dB
25 dB SNR is considered pretty solid. Your Wi‑Fi should "hum along" nicely.
If your SNR drops below about 20 dB, you'll start to notice sluggishness and retries. Below 10 dB? Expect chaos: packets drop; latency spikes; and users start muttering dark things about IT.
Here's a simple rule of thumb:
SNR (dB) Connection Quality
40+ Fantastic
25-40 Good
15-25 Fair (watch for drops)
<15 Poor (expect trouble)
Why Wi‑Fi Engineers Care So Much
Wi‑Fi engineers are basically sound engineers for invisible radio waves. Their job is to keep the signal loud and clear while minimizing the noise. SNR drives key design decisions, such as where to place access points (APs), how to set transmit power, and which channels to use.
Here's why it matters so much:
• Performance tuning: A high SNR means higher data rates and fewer retries, which boosts throughput. Poor SNR means wasted airtime and grumpy users.
• Capacity planning: Understanding noise helps engineers predict how many APs can coexist in a space without interfering with each other.
• Interference management: By measuring noise sources, engineers can track down rogue devices, non‑Wi‑Fi interference, or even misconfigured APs.
• Roaming behavior: Devices naturally cling to stronger signals. If an area's SNR drops too low, users may drift toward another AP... or just lose connection mid‑Zoom call.
Think of SNR as the "mood ring" of wireless health. Happy networks have high SNR. Unhappy ones have engineers crawling on ceilings with spectrum analyzers.
Practical Tips for New IT Engineers
Here are a few, helpful, "rule-of-thumb" tips:
• Survey before you deploy. Always measure signal and noise levels before placing APs. Free tools like Wi‑Fi analyzers can give quick insights.
• Mind your channels. Overlapping channels cause self-inflicted noise. Stick to non‑overlapping ones whenever possible (like channels 1, 6, and 11 on 2.4 GHz).
• Reduce interference. Turn off or relocate devices that emit RF noise: microwave ovens, Bluetooth speakers, and even some LED lights!
• Don't rely on bars. That "three bars" icon on your phone? It hides all the metrics that actually matter. Always check SNR or RSSI directly.
Food for Thought...
Signal-to-Noise-Ratio might sound like arcane tech jargon, but it boils down to a simple question: “Can your network hear itself think?”
For Wi‑Fi engineers, SNR isn't just a number: it's the pulse of the network, the difference between smooth connectivity and jittery chaos.
So, next time someone complains about slow Wi‑Fi, resist the urge to reboot everything. Instead, grab a tool, check that SNR, and see who's really yelling louder: the signal or the noise?
===
===
Learn More
If you want to learn more about our wireless training and wireless networks, visit our training portfolio page here
===
#WiFi #WirelessNetworks
===
About NC-Expert
NC-Expert is a privately-held California corporation and is well established within the Wireless, Security, and CyberSecurity industry certification training, courseware development, and consulting markets.
NC-Expert has won numerous private contracts with Fortune level companies around the world. These customers have depended on NC-Expert to train, advise, and mentor their staff.
So remember, if you are looking for the best IT training just call us at (855) 941-2121 or contact us
NC-Expert Blog